Humans have an uncanny ability to find apparent "patterns" in things, even when it is complete nonsense. Prime examples are seeing faces in Clouds and a 'House that looks like Hitler'.
The same may be true for the current hype around the "banwave", so lets find something objective we can use to look at this better. Ok, how about we use the "Number of new threads in the Ban Section each Month" as a measure for how many people are talking about bans over time. It's not perfect, I am not counting the number of reported banned accounts, and some of the threads we count may be discussion and not ban-reports but it is better than nothing.
I wrote a little script to:
Here are the results:
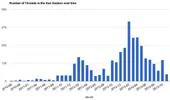
Number of new threads in the Ban Section by month:

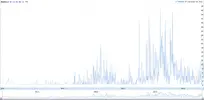
Number of new threads in the Ban Section by date:

While it feels like there is a "banwave" going on at the moment the numbers illustrate a different story.
I've published the Google Spreadsheet if you want to see the underlying data or use the charts interactively.
The same may be true for the current hype around the "banwave", so lets find something objective we can use to look at this better. Ok, how about we use the "Number of new threads in the Ban Section each Month" as a measure for how many people are talking about bans over time. It's not perfect, I am not counting the number of reported banned accounts, and some of the threads we count may be discussion and not ban-reports but it is better than nothing.
I wrote a little script to:
- fetch each page of threads from the Ban Section
- parse out the date each thread was created
- count up the number of new threads created for each date
Here are the results:
- the forums have been much busier in the past (February 2013 had 416 new threads)
- the average number of new threads each month is 98.97
- October 2013 was 'above average' with 147 threads
- so far this month there have been 48 new threads
- the most new threads (by date) was February 14th 2013 with 38 new threads (on valentines, lol)
- the average number of new threads each day is 4.96
- with the exception of yesterday (18 threads) November is around average on a daily number of new threads
Number of new threads in the Ban Section by month:

Number of new threads in the Ban Section by date:

While it feels like there is a "banwave" going on at the moment the numbers illustrate a different story.
I've published the Google Spreadsheet if you want to see the underlying data or use the charts interactively.


